
Why Your DM Reply Rate Doesn’t Mean What You Think It Means
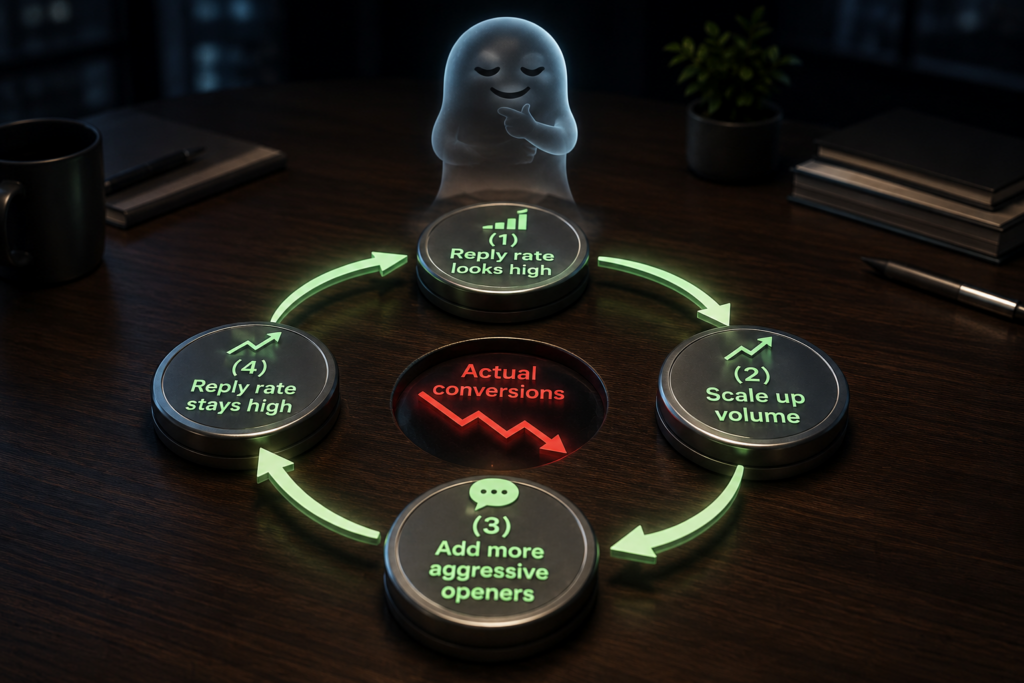

Your DM automation reports a 12% reply rate. That’s a good number. Better than industry average. Better than what most operators post as benchmarks. You feel like the campaign is working. You scale up volume, add accounts, expand the source list.
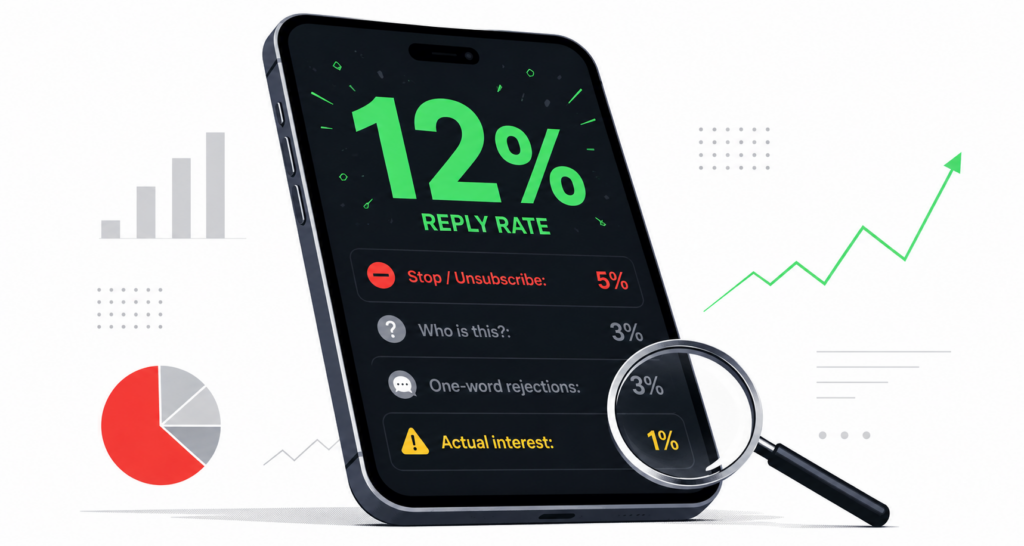
Then you check the actual conversation logs. Half the replies are “stop messaging me.” Another quarter are “who is this.” A handful are curse words. The tiny fraction that are actual engagement — someone genuinely interested, someone asking a question you can convert on — is much smaller than 12%. Closer to 2%, sometimes less.
Your reply rate wasn’t lying. It was just measuring something different from what you thought you were measuring. Reply rate counts any inbound message triggered by your outbound. It doesn’t care whether the reply is positive, negative, hostile, or a bot response. Everything that hits the inbox after your DM counts.
What replies actually look like at scale
Once you sort through a few thousand cold DM replies, the distribution starts looking pretty consistent:
The “stop” replies. Some percentage of everyone you cold-message tells you to stop. On Instagram it might be 30-40% of all replies. On Twitter DMs it’s higher because the platform culture is more confrontational. On dating apps in the wrong niche it can hit 60%. These replies count in your reply rate. They also count as user reports against your account if the recipient escalates, which they sometimes do.
The “who is this” replies. The recipient doesn’t remember the context, doesn’t recognize the sender, thinks it’s a wrong number or a mistake. These are neutral — sometimes convertible if you have a good follow-up, mostly not. They inflate reply rate without producing outcomes.
The one-word rejections. “No.” “Not interested.” “Pass.” These read as replies to your DM automation but represent zero conversion potential. The user engaged just enough to close the loop, no more.
The curse words and abuse. Small percentage but nonzero. Absolutely counts in your reply rate. Absolutely not something you want to be counting.
The auto-replies. Business accounts, creators with vacation responders, chatter automation on the other side — these all fire back messages that count as replies but aren’t from humans considering your offer.
The genuine engagement. Actual questions, requests for info, expressions of interest. The replies you actually built the DM strategy for. This subset is usually much smaller than the raw reply rate suggests.
Why raw reply rate stays high anyway
The failure mode is that all six categories above roll up into one metric. Reply rate as most dashboards measure it is just “did anything come back” divided by “how many did we send.” The dashboard can’t tell whether the reply was a conversion or a middle finger.
Over time this creates a compounding illusion. You optimize for reply rate. Your opener gets more provocative because provocative openers generate more responses. More responses include more hostile ones. Reply rate stays high or even climbs. Your actual conversion rate — the metric that matters for revenue or growth — drops.
By the time you notice conversions aren’t scaling with reply rate, you’ve been running the wrong optimization loop for months. The specific campaigns you were expanding because “they were working” were actually generating hostility at scale.
What to measure instead
The metric that actually matters is qualified reply rate — replies that indicate genuine interest, not just any inbound message. There’s no fully automated way to compute this, but you can get close:
Filter out the negatives. Simple keyword filtering catches most “stop,” “unsubscribe,” “not interested,” and the common curse words. Everything that doesn’t hit the filter is more likely to be a genuine reply. This is a rough cut but it removes the loudest noise.
Track conversation length. Genuine interest usually produces multi-message conversations. Hostile replies are usually one message. If you’re tracking how many replies turn into actual back-and-forth exchanges, that’s a much cleaner signal than raw reply count.
Sample manual review. Every week, pull a sample of 50 replies and classify them by hand. Positive / neutral / negative. The ratios you see in the sample let you translate raw reply rate into approximate qualified reply rate. If 40% of your sample is negative, your real conversion-relevant reply rate is roughly 60% of what the dashboard says.
Sentiment analysis at scale. If you’re running enough DM volume that manual review isn’t practical, AI sentiment classification handles this — feed the incoming replies through a sentiment classifier, sort into positive/neutral/negative, use the positive-only count as your real reply metric. This is what more sophisticated chatter workflows already do to route hot leads to human chatters.
What this changes about strategy
Once you’re measuring qualified reply rate instead of raw reply rate, some campaigns you thought were successful stop looking successful. Openers that generate maximum response volume aren’t always the ones generating maximum genuine interest. Provocative or aggressive openers get high raw response but skew heavily toward negative sentiment. Softer openers get lower raw response but skew more positive.
The tradeoff isn’t obvious in raw numbers. It’s very obvious in qualified reply rate. Some operators discover their best-converting openers are the ones with the lowest raw reply rate because those openers self-filter — only people genuinely interested bother to respond, and the ones who do respond convert well.
Volume also matters differently. Cranking DM output to squeeze more replies out of the same source list often lowers qualified reply rate faster than it raises raw reply rate, because you’re contacting more marginal targets who reply to reject rather than genuine prospects who reply to engage. Higher volume + lower quality can produce the same or lower absolute conversion count.
Where this hits Onimator operators
Onimator’s DM Tool tracks reply rate as one of its performance signals. That number is raw reply rate — everything that comes back gets counted. If you’re using it to evaluate campaign performance without sorting for quality, you’re getting the illusion.
The fix isn’t to abandon the tool’s metric — it’s to layer qualified analysis on top. Export the reply logs, sample-classify them, or run them through an AI chatter platform’s sentiment layer if you have one integrated. What you’ll see is that your actual conversion-relevant reply rate is meaningfully lower than the raw number, and the ratio between the two shifts based on how aggressive your openers and volume are.
Operators who understand this measure both numbers and optimize for the ratio, not just the raw. The strategies that produce sustainable long-term output are the ones that keep qualified reply rate high even at the cost of raw reply rate. The strategies that maximize raw reply rate at the cost of qualified reply rate produce impressive dashboards and mediocre conversions.
What matters is which reply came from someone who might buy, subscribe, follow up, or convert. Everything else is noise inflating a number that doesn’t measure what you thought it measured.
Don't stop at reading.
Join the community or pick a plan and start automating today.
Get help, share wins, stay ahead.
Thousands of operators, direct support from the team, and a live feed of updates, tips and drops.
- Live support and troubleshooting from the team and power users
- Setup walkthroughs, targeting tips and workflow templates
- Early word on new bots, features and releases
Ready to put growth on autopilot?
Run your accounts, clients or traffic funnel while Onimator does the work. Start scaling today.
- Unlimited accounts
- All available tasks
- Integrated AI Chatter
- Up to 7 devices