
Why Your TikTok Videos Aren’t Hitting the FYP — The Watch-Time Signal Creators Miss
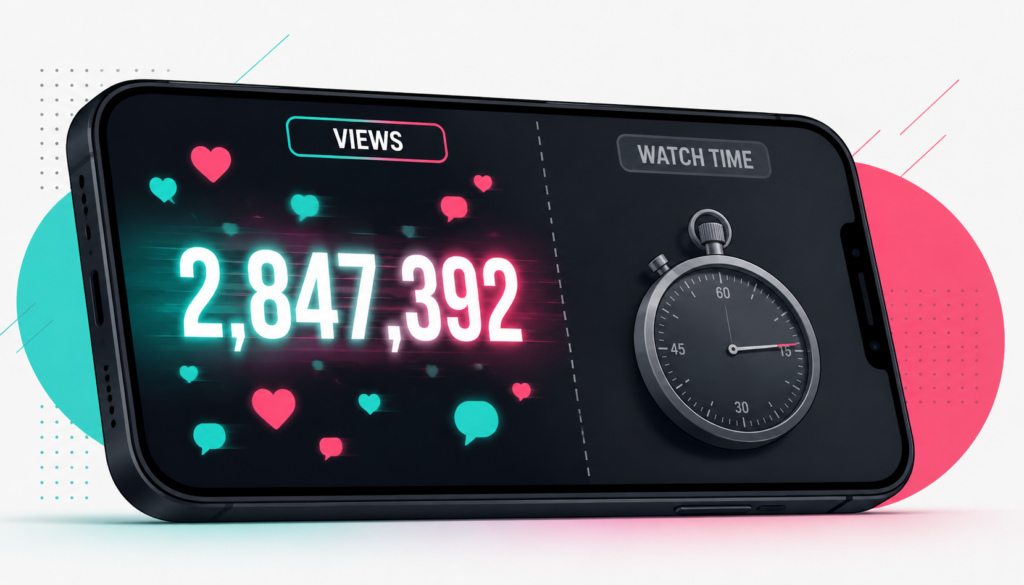

A creator publishes a TikTok video that looks like everything they’ve published before. Same account, same content style, similar production quality, posted at their usual hour. Within an hour it has ten thousand views and looks like it’s going to be one of their bigger posts. Then the view counter stops moving. By the end of the day, it’s stalled at maybe fifteen thousand views total. Meanwhile, another video from the same account — published a week earlier, with lower initial view count and a slower start — has kept climbing steadily and crossed a million views by the same evening.
The creator looks at the two videos side by side and can’t find what’s different. The captions are similar. The hashtags are the same. The initial engagement rate on the failed video was actually higher than on the successful one. But the failed video hit a distribution ceiling that the successful one never encountered, and no amount of analyzing surface metrics reveals why.
The reason is a signal most creators never explicitly track and that TikTok’s algorithm weights more heavily than every other engagement metric combined. It’s not likes. It’s not comments. It’s not even follows generated from the post. It’s the specific cumulative attention viewers actually gave the video — the aggregate seconds of viewing time summed across every person who saw it. On TikTok, watch time is what the ranking model actually optimizes for, and creators who optimize for anything else consistently underperform on the platform regardless of how sophisticated their other content strategy is.
Views are the metric that shows up in the counter. Watch time is the metric that decides whether the counter keeps climbing.
The Signal TikTok Actually Cares About
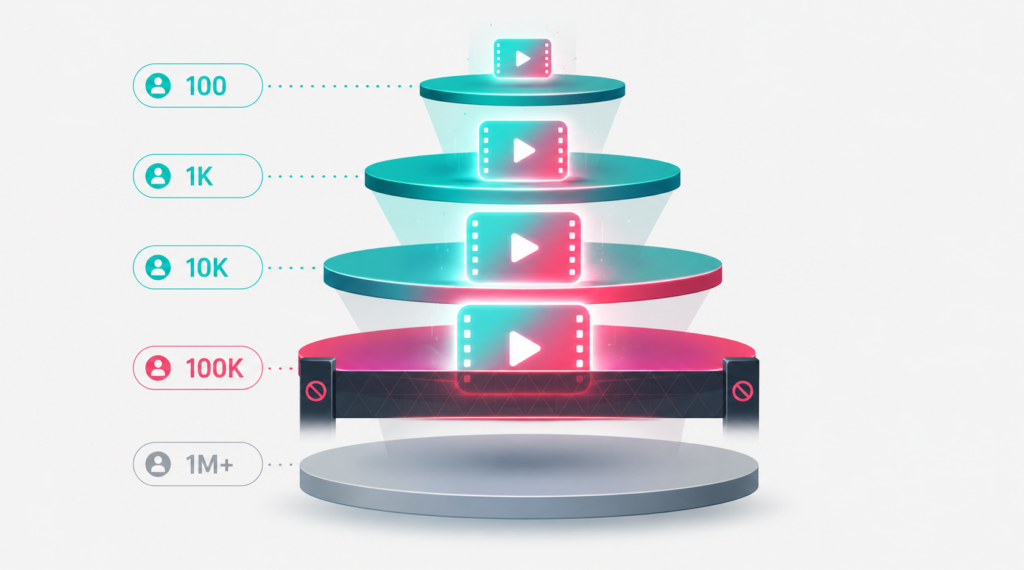
The For You Page is essentially the only meaningful distribution surface on TikTok. Profile visits, hashtag pages, and follower feeds produce a small fraction of the traffic FYP does. Every video’s reach on TikTok is determined by whether it advances through successive tiers of FYP evaluation, and each tier tests the video against a larger and more diverse audience than the tier before. Videos that clear tier evaluations compound distribution across tiers; videos that fail stay capped at whatever tier they last cleared.
The specific signal that drives tier advancement isn’t view count. It’s watch time — the cumulative duration viewers spent watching the video, summed across every viewer who saw it. A video that got a million impressions where the average viewer watched three seconds produces materially less watch time than a video with a hundred thousand impressions where the average viewer watched twenty seconds. TikTok’s algorithm treats the second video as materially more successful even though the first has ten times the view count, because the second delivered ten times the retained attention per viewer.
Every subsequent tier evaluation applies the same test. High watch time per viewer advances the video; low watch time per viewer caps it. Views themselves are just the denominator; the algorithm’s real question is what fraction of those views converted into retained attention.
Why Views Are the Wrong Metric to Chase
The specific reason chasing view count backfires on TikTok is that view count is a noisy signal that includes viewers who didn’t actually watch the video. On a scroll-based feed, a view registers when the video appears on someone’s screen — which happens automatically for every video the user scrolls past. The view count includes the users who scrolled past in the first second along with the users who watched to completion, and TikTok’s algorithm knows the difference between these viewer categories even when the view count doesn’t distinguish them.
Creators optimizing for view count typically pursue tactics that inflate the metric without generating the underlying attention the algorithm rewards. Misleading thumbnails and clickbait openers produce initial view spikes because more users tap through, but tank per-viewer watch time because those users disengage as soon as they realize the content doesn’t match the promise. Hook-bait videos that promise a payoff and never deliver produce the same pattern — high view count, low watch time, and a distribution ceiling the algorithm applies precisely because the watch-time signal indicated the content wasn’t holding attention.
The specific pattern this produces is the video that hits ten thousand views in the first hour and then dies. The initial spike came from the clickbait mechanism successfully getting users to tap through. The stall came from the algorithm’s watch-time evaluation deciding the video didn’t clear the retention threshold and shouldn’t advance to broader tiers. The view spike was the visible signal; the watch-time evaluation was the invisible one that actually determined distribution.
What High Watch Time Actually Requires
Producing high per-viewer watch time reduces to keeping viewers watching moment-to-moment throughout the video. Several specific mechanics matter more than most creators realize.
The first three seconds are load-bearing. TikTok’s largest single drop-off happens in the first three seconds of any video — viewers decide almost instantly whether to keep watching or scroll. Videos that lose viewers in this window don’t clear the first-tier early-engagement threshold regardless of everything after. Strong opens (compelling first frames, immediate hooks, visual pattern breaks) drive first-tier retention. Slow opens (long intros, scene-setting before the hook) lose viewers before the algorithm gets any signal about the rest of the video’s quality.
Mid-video pattern breaks matter next. Real users lose focus during long uninterrupted content, and the specific way they signal it to TikTok is by scrolling away mid-video. Pattern breaks — visual cuts, tone changes, unexpected moments — reset viewer attention and prevent the mid-video drop-off that reduces average watch time per viewer. Videos designed with pattern breaks every few seconds hold retention materially better than videos with even production quality throughout.
Curiosity gaps pull viewers through longer durations than they would have stayed for otherwise. Leaving important information for later in the video, promising a payoff that arrives at the end, structuring the content so the viewer needs to see the finish to understand the beginning — all specific tactics that raise per-viewer watch time by giving viewers a reason to stay past the point where they might otherwise scroll.
Looping content produces rewatches, which stack additional watch time per viewer without requiring the video to be longer. Videos designed to visually loop back to their beginning when they end — where the last frame connects naturally to the first frame — produce measurable rewatch behavior that shows up in the aggregate watch time metric.
The Watch Time vs. Completion Rate Trade-Off
Watch time and video completion rate measure related but distinct things. Watch time is the aggregate duration across all viewers. Completion rate is the percentage of viewers who watched to the end. Both signals feed the algorithm, but they diverge in the specific case of videos with different lengths.
A 15-second video with 80% completion produces watch time proportional to (15 × 0.8 × viewer count) = 12 seconds per viewer. A 60-second video with 40% completion produces (60 × 0.4 × viewer count) = 24 seconds per viewer — twice the watch time per viewer at half the completion rate. The 60-second video generates more retained attention despite fewer viewers reaching the end.
The practical implication is that creators can’t optimize for either signal in isolation. Making videos longer to accumulate more watch time backfires if it tanks completion rate too far. Making videos shorter to maximize completion backfires if it caps watch time. Well-performing content balances both — long enough to generate meaningful per-viewer attention, short enough that a strong fraction of viewers reach the end. The specific right length depends on content type, but the underlying principle is that neither dimension can be maximized at the expense of the other.
Why Coordinated Engagement Fails on TikTok
On Instagram, coordinated engagement dispatch (a network of accounts liking, commenting, and saving a new post within the first minutes) captures the early-engagement bonus and produces materially higher distribution outcomes. On TikTok, the same tactic produces materially smaller returns because the FYP algorithm weights coordinated surface engagement much lower than it weights organic watch time from real viewers who actually consumed the content.
The specific mechanism is that TikTok’s ranking model treats watch time as a primary signal and surface engagements (likes, comments, follows) as secondary confirmations. Coordinated dispatch that generates surface engagements without generating watch time signals to the algorithm that the engagement isn’t organic — real viewers who liked the video would have watched it, and the missing watch time indicates the like came from somewhere other than genuine attention.
The practical implication for TikTok growth strategies is that automation and coordinated engagement produce lower relative returns than they do on Instagram. TikTok growth is more content-dependent than engagement-dispatch-dependent, and strategies that don’t optimize the underlying content for watch time can’t compensate through coordinated dispatch the way Instagram strategies can.
The Analytics That Actually Matter
TikTok’s analytics expose watch time as both an absolute number (total watched seconds across all viewers) and as derived metrics (average watch time per viewer, watch time percentage distribution across the video’s length). Creators serious about TikTok growth track both.
The absolute watch time number tells the creator overall video scale — how much retained attention the video generated in aggregate. This maps roughly to distribution outcomes.
The average watch time per viewer tells the creator content quality independent of scale. A video with strong per-viewer watch time but low view count indicates content that resonates but didn’t reach broad audiences; a video with weak per-viewer watch time but high view count indicates the reverse. Both patterns require different responses — the first calls for distribution amplification, the second calls for content improvement.
Watch time percentage distribution shows the specific curve of viewer drop-off across the video’s length. Videos where the curve drops steeply in the first three seconds have a hook problem. Videos where the curve drops smoothly throughout have a pacing problem. Videos where the curve holds mostly flat until near the end have a strong content shape that the algorithm rewards with tier advancement.
Where Watch Time Fits in the Growth Stack
Watch time is the specific algorithmic mechanic that makes TikTok content strategy fundamentally different from Instagram content strategy. Growth tactics that work on Instagram — hashtag optimization, follower-count scaling, coordinated engagement dispatch, posting-time targeting — apply differently or produce smaller returns on TikTok because the FYP centers on watch-behavior signals rather than on the follower-and-timing signals Instagram’s feed algorithm weights heavily.
For operators running cross-platform video strategies, the specific implication is that the same video can perform completely differently across platforms based on which watch-behavior signal each platform’s algorithm weights most heavily. Content optimized purely for Instagram’s engagement-and-timing model may underperform on TikTok despite identical production quality, and vice versa. Understanding which signal each platform actually rewards is what makes cross-platform strategies produce their intended results rather than producing viral moments on one platform and stagnation on the other.
TikTok rewards attention. Not views, not likes, not follows — the specific seconds of retained attention viewers actually gave the video. Creators who optimize for the visible surface metrics and ignore the invisible attention signal produce the specific pattern where every post looks like it should work and half of them don’t. Creators who optimize for watch time explicitly produce the outcomes the visible metrics only sometimes correlate with. The signal is invisible. The distribution outcomes it drives are not.
Don't stop at reading.
Join the community or pick a plan and start automating today.
Get help, share wins, stay ahead.
Thousands of operators, direct support from the team, and a live feed of updates, tips and drops.
- Live support and troubleshooting from the team and power users
- Setup walkthroughs, targeting tips and workflow templates
- Early word on new bots, features and releases
Ready to put growth on autopilot?
Run your accounts, clients or traffic funnel while Onimator does the work. Start scaling today.
- Unlimited accounts
- All available tasks
- Integrated AI Chatter
- Up to 7 devices