🧠 Overview
The Stats Analyzer is the Onimator Helper Suite’s reporting module. Pick a date range, click Generate Report, and the suite pulls aggregated action counters straight from your bot folder, per account and per device, no spreadsheet wrangling required.
It’s the answer to “how much did this account / device actually do this week?”, an essential check for agencies tracking per-client delivery, growth operators sanity-checking automation output, and anyone scaling beyond one account.
💡 Strategic Purpose: Replace the “log into every account and count by hand” workflow with a single report. Especially valuable when you’re running 10, 50, 100+ accounts and need a fast, accurate readout of how much each one shipped.
🔁 How It Fits with Onimator
Stats Analyzer reads from Onimator’s bot folder (the install that’s running your accounts). It doesn’t post or change anything, it just aggregates the activity counters Onimator has already recorded.
Onimator (running) → action counters logged → Stats Analyzer reads bot folder → Aggregated report
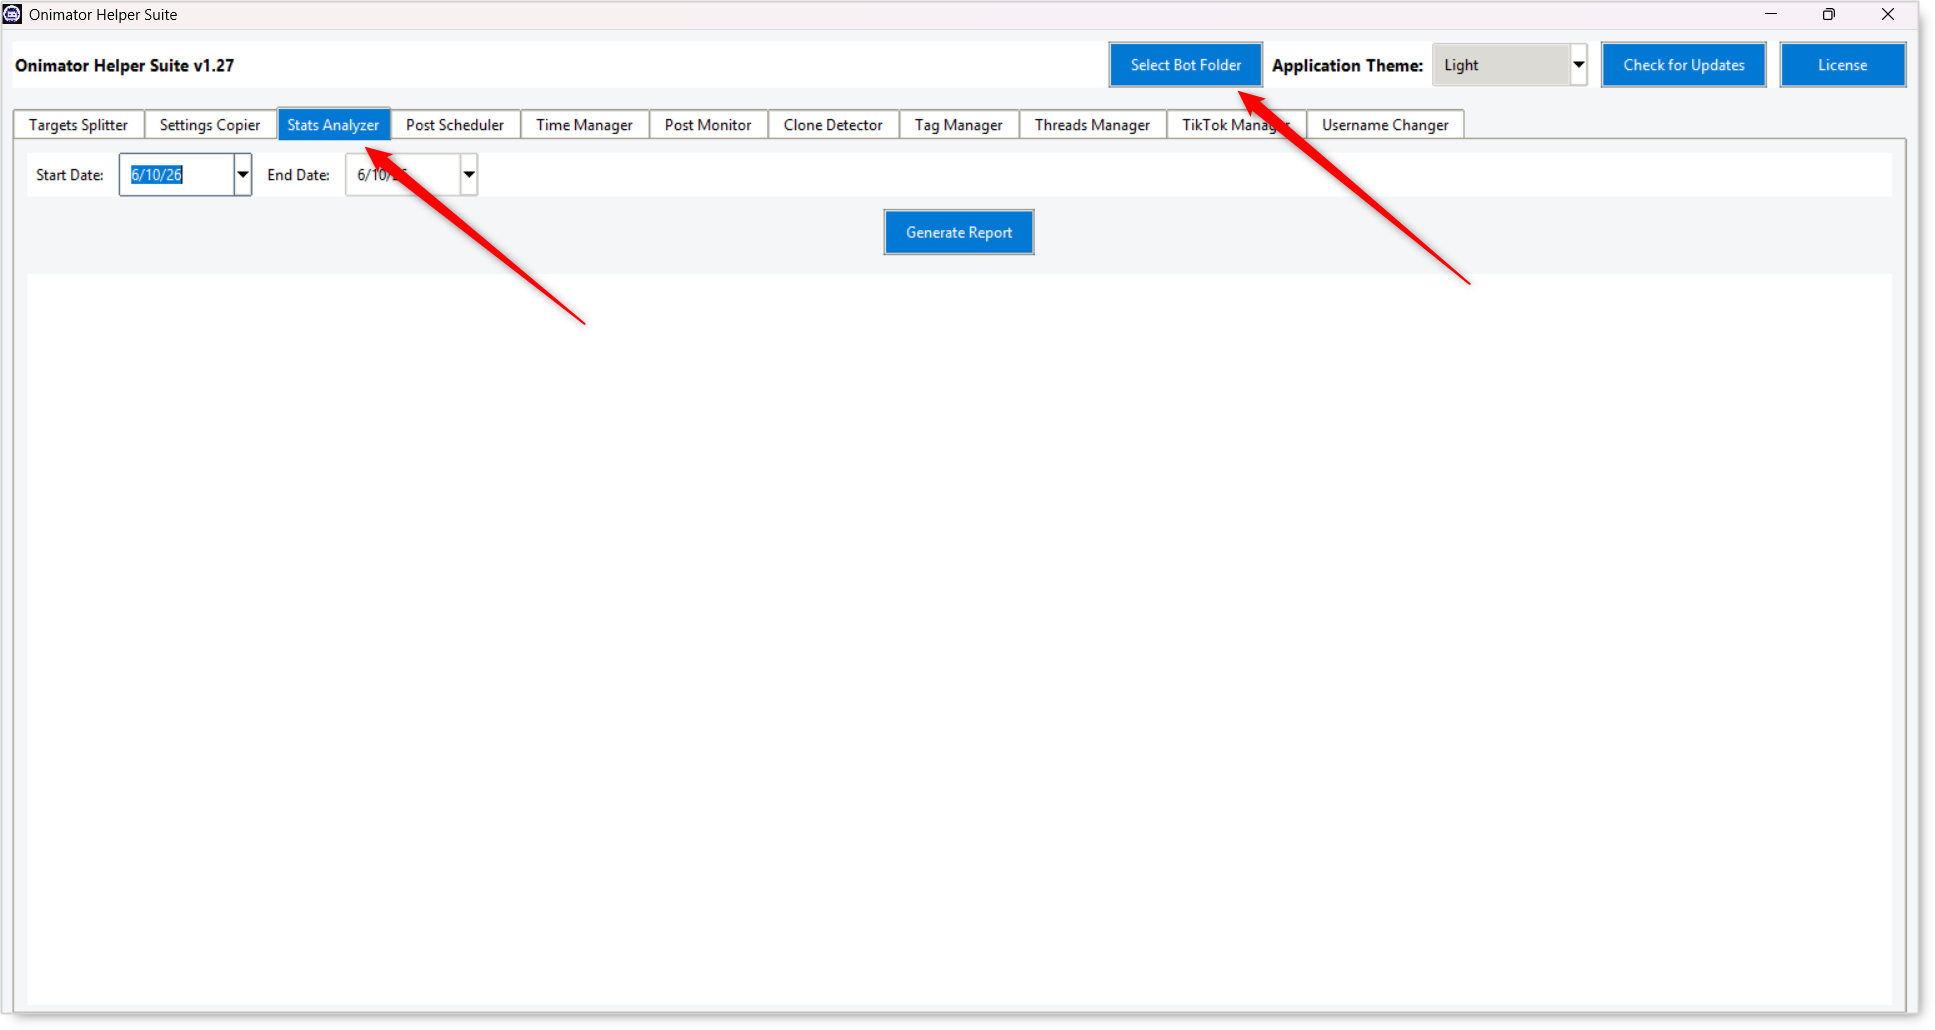
⚠️ You must point the suite at the bot folder first (header → Select Bot Folder), or the report will come back empty / zeros for everything.
🚀 Key Features
- Date-Range Report — Pick any start / end date.
- Per-Account Breakdown — Every account on every device gets its own row.
- Per-Device Breakdown — Aggregated totals at the device level.
- Action Counters Covered — Follows, Unfollows, Likes, Messages, Story Views, Story Likes, Followers Gained, Total Actions.
- One-Click Generation — Single Generate Report button.
⚙️ Access the Stats Analyzer
- Open the Onimator Helper Suite.
- In the suite’s header, click Select Bot Folder and point at your Onimator bot folder. Required, the analyzer reads its data from here.
- Click the Stats Analyzer tab in the top tab row.
🔧 Generating a Report
Step 1: Confirm the Bot Folder Is Selected
⚠️ This is the #1 precondition. If you skip it, the report runs but every column shows
0.
Look at the suite’s header. The Select Bot Folder button should be set; if you’re not sure, click it again and re-pick the folder.
Step 2: Set the Date Range
- Start Date (date picker) — first day to include.
- End Date (date picker) — last day to include.
Both are inclusive. Set both to the same day for a one-day snapshot, or span a week / month for a trend view.
Step 3: Generate the Report
Click Generate Report. Two sub-tabs appear below with the results:
- Account Stats
- Device Stats
📊 Report Output
Sub-Tab: Account Stats
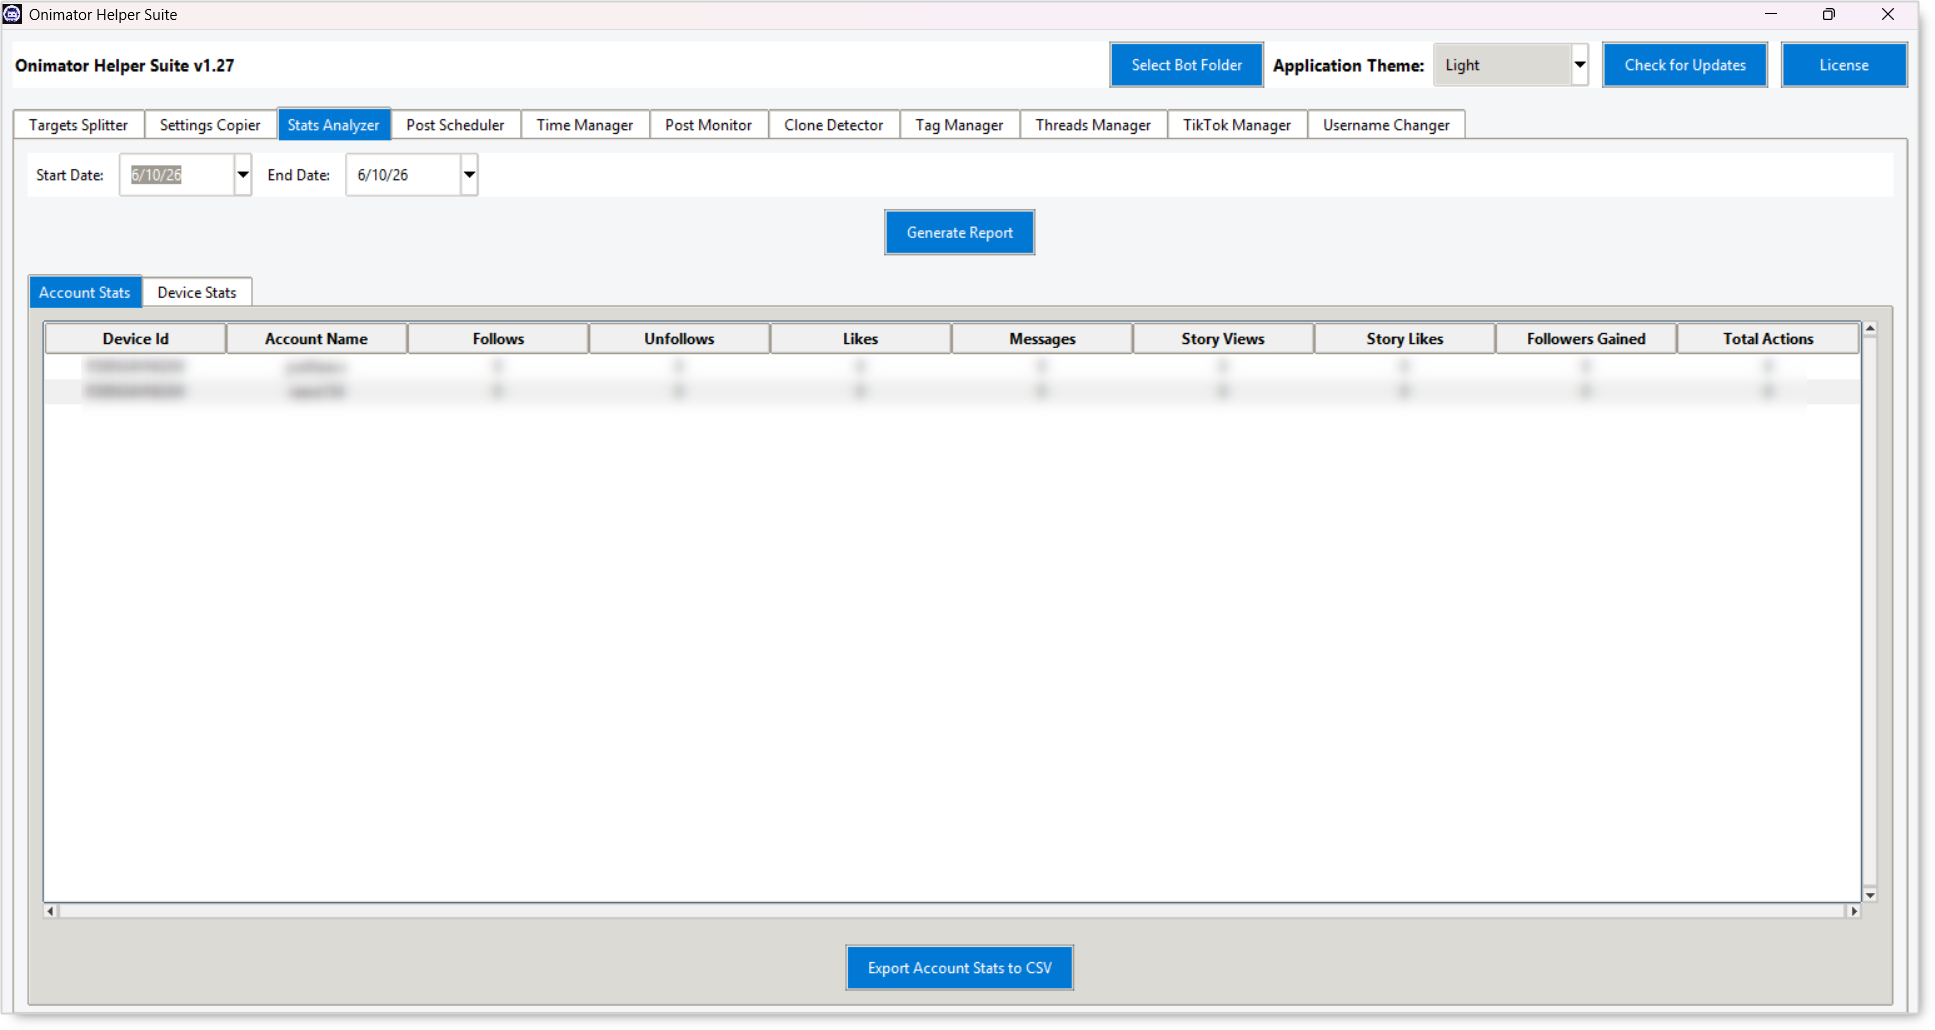 One row per (device, account) combination. Columns:
| Column | What it counts |
|---|---|
| Device Id | Hardware ID of the phone the account runs on. |
| Account Name | The username on that device. |
| Follows | Follow actions performed in the date range. |
| Unfollows | Unfollow actions performed. |
| Likes | Like actions performed (across all tools that like). |
| Messages | Outbound messages sent. |
| Story Views | Stories watched. |
| Story Likes | Stories liked. |
| Followers Gained | Net new followers in the date range. |
| Total Actions | Sum of every action above. |
📘 An account with 0 across every column usually means one of three things: the bot wasn’t running in that window, Stats Analyzer isn’t pointed at the right bot folder, or the account was paused. Check the Select Bot Folder first.
Sub-Tab: Device Stats
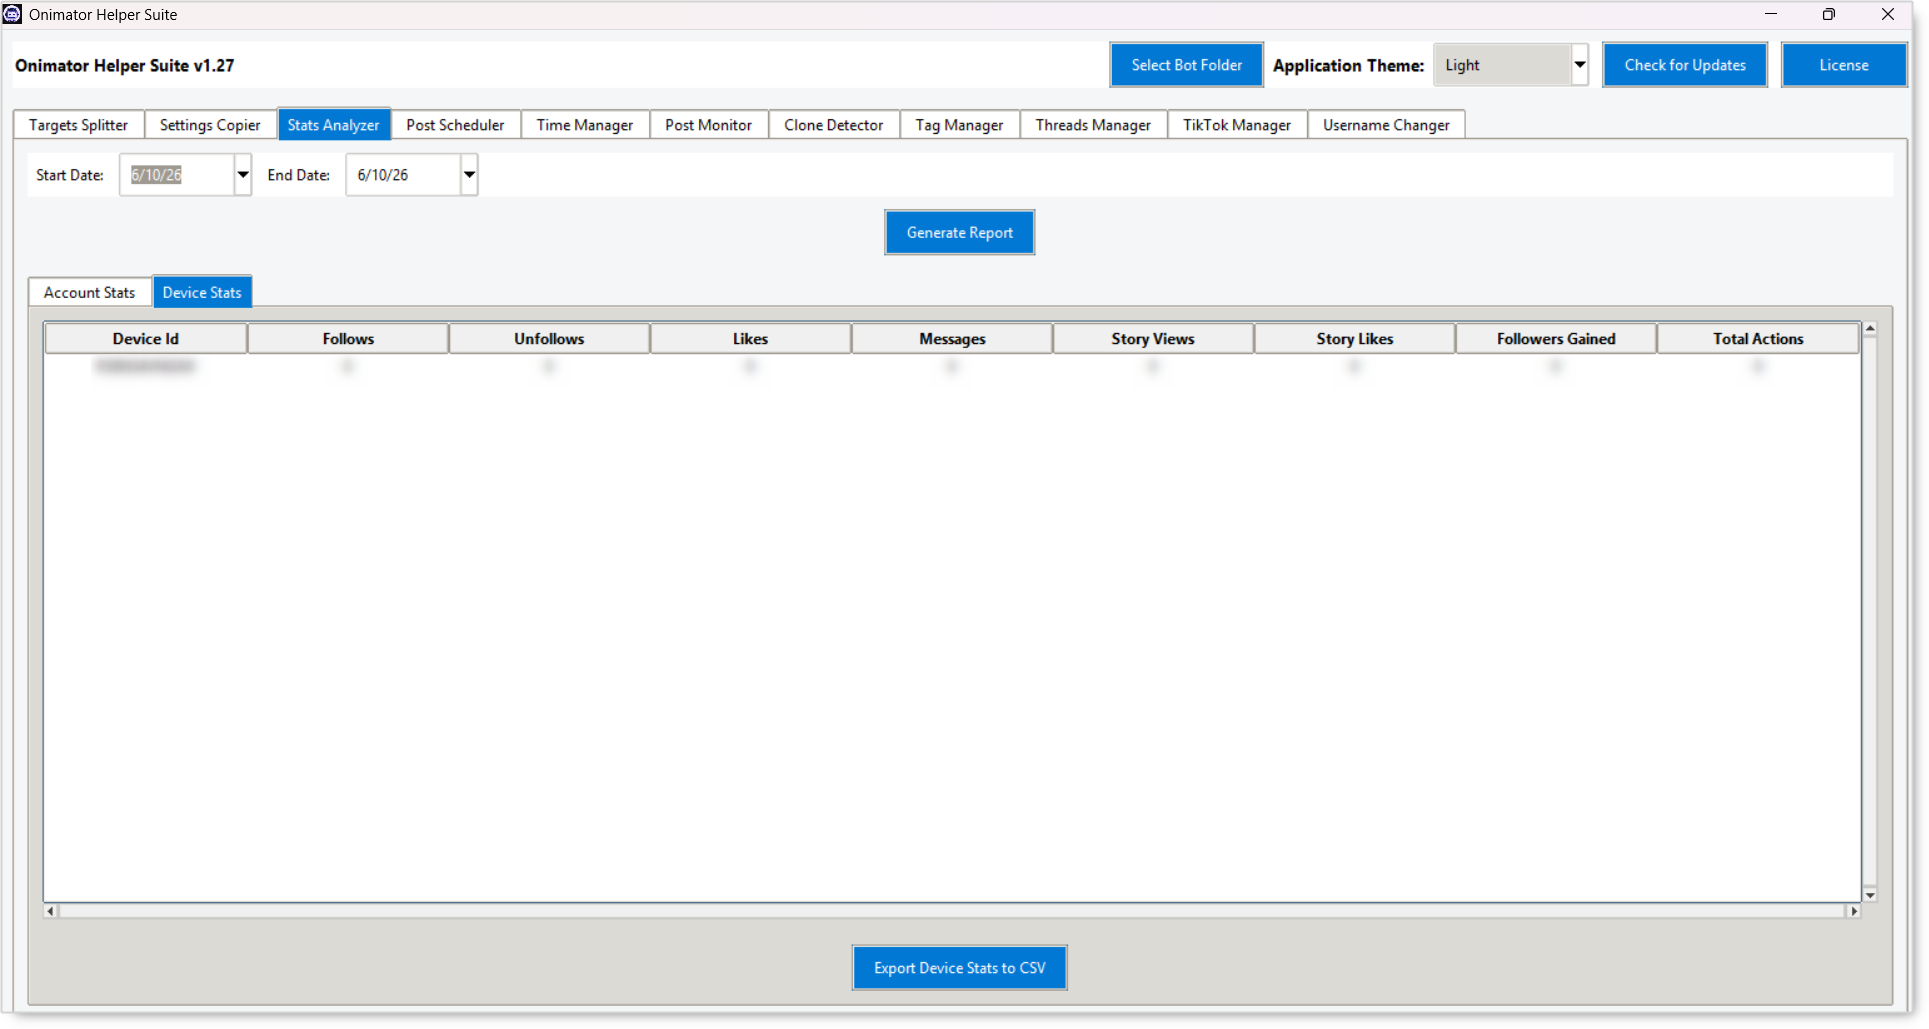 Per-device aggregation, totals rolled up across every account on each phone. Useful when you want to compare device throughput rather than per-account performance.
📅 Recommended Workflow
Daily Sanity Check
- Set Start Date = End Date = today.
- Click Generate Report.
- Scan the Account Stats table for any account with unusually low Total Actions vs. its peers, that’s the one to investigate.
Weekly Review
- Set Start Date = last Monday, End Date = today.
- Click Generate Report.
- Review Followers Gained column across accounts, spot which accounts are growing and which aren’t.
- Use Device Stats to check if a particular device is underperforming (could indicate a stuck phone, expired session, or restricted account).
Client Delivery Reports (Agencies)
- Set the date range to the client’s billing period.
- Click Generate Report.
- Filter / screenshot the Account Stats rows for that client’s accounts.
- Use as the delivery proof for the period.
🔐 Best Practices
Always Select Bot Folder First
The single most common cause of “all zeros” reports. Set this before doing anything else, then leave it set for the session.
Use Same-Day Reports for Daily Health Checks
A one-day window highlights which accounts ran cleanly vs. which stalled, the fastest way to catch a paused / blocked account.
Use Multi-Day Windows for Trend Tracking
Single-day numbers fluctuate. Weekly / monthly windows reveal real patterns, who’s growing, who’s plateauing, which device profiles are hot.
Cross-Check with Followers Gained
Total Actions and Followers Gained should roughly correlate. An account with high actions but flat follower growth is signaling something: bad targeting, shadow-restriction, low-quality content, or the audience just isn’t following back.
Pair Stats Analyzer with the Bots’ Own Daily Caps
If Follows regularly hits exactly the daily cap you set, the bot is healthy. If it consistently falls short, something’s throttling it (Timer Tab, account flag, source pool dry, etc.).
⚠️ Common Issues
Every Column Shows 0
Cause: The suite isn’t pointed at the Onimator bot folder, or the bot wasn’t running in that window. Fix: Header → Select Bot Folder → confirm it’s the live Onimator install → re-generate.
Some Accounts Missing from the Table
Cause: Those accounts don’t exist in the bot folder you’ve selected (wrong install / clone), or they were added after the date range you’ve chosen. Fix: Confirm the bot folder, and double-check the account exists in Onimator’s Devices view.
Followers Gained Is Negative
Cause: Net new followers in the window was negative, you lost more than you gained. Not a Stats Analyzer bug; the account is shrinking. Fix: Investigate the account, check for recent restrictions, content quality, or unfollow-tool over-pacing.
🏁 Conclusion
- Aggregated reporting — Action counters and follower growth, per account and per device.
- Reads from the bot folder — Always Select Bot Folder first.
- Two output views — Account Stats (per account) and Device Stats (per device).
- Eight action counters + Total Actions — Follows, Unfollows, Likes, Messages, Story Views, Story Likes, Followers Gained, Total Actions.
- Date-range flexible — One-day snapshots to multi-week trend reports.
💡 Implementation Tip: Wire Stats Analyzer into your weekly ops routine. Every Monday, generate a same-week report → spot any account whose Total Actions is dramatically below its peers → that’s your investigation target for the week. Combined with monthly Followers Gained trend reports, you’ve got a complete health check that runs in under two minutes.
🎥 Tutorials & Support
- This article covers Part 3 of the OniHelper tutorial series (Stats Analyzer). The next part covers the Post Scheduler feature.
- Telegram Support: Join Onimator Support